
UI Reference
The Chain Nodes platform is organised into specialised pages accessible from the icon sidebar on the left. A live WebSocket indicator at the bottom of the sidebar shows the real-time connection status (green = connected).
Dashboard
Route: /dashboard
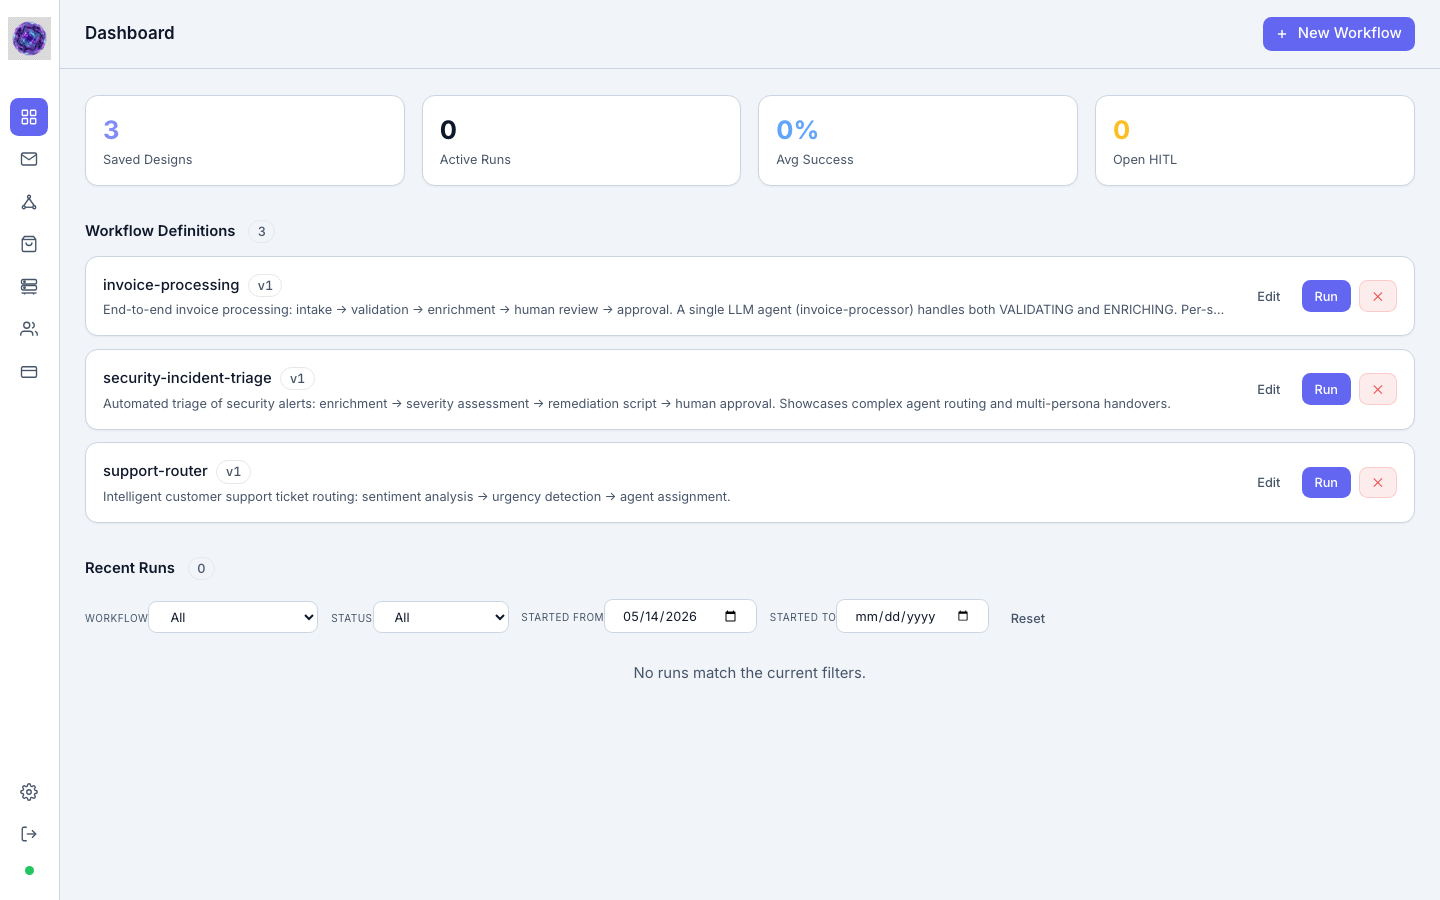
The central command center for your agentic fleet. It gives you an at-a-glance view of the health and activity of all workflows running under your tenant.
KPI Cards
Four summary cards sit at the top of the page:
| Card | What it shows |
|---|---|
| Saved Designs | Total number of workflow definitions stored in the platform |
| Active Runs | Workflow executions currently in progress |
| Avg Success | Rolling success rate across all recent runs |
| Open HITL | Human-in-the-loop tasks awaiting operator review |
Workflow Definitions
A list of every versioned workflow definition. Each row shows the workflow name, version badge, and a plain-language description of the process. Two actions are available per row:
- Edit — opens the workflow in the Designer
- Run — launches a new execution instance immediately
- Delete (×) — removes the definition
The + New Workflow button in the top-right corner opens a blank Designer canvas.
Recent Runs
A filterable table of the most recent workflow executions. Filters include workflow name, status, and a date range (Started From / Started To). Clearing filters with the Reset button restores the default date window.
Inbox (Task Queue)
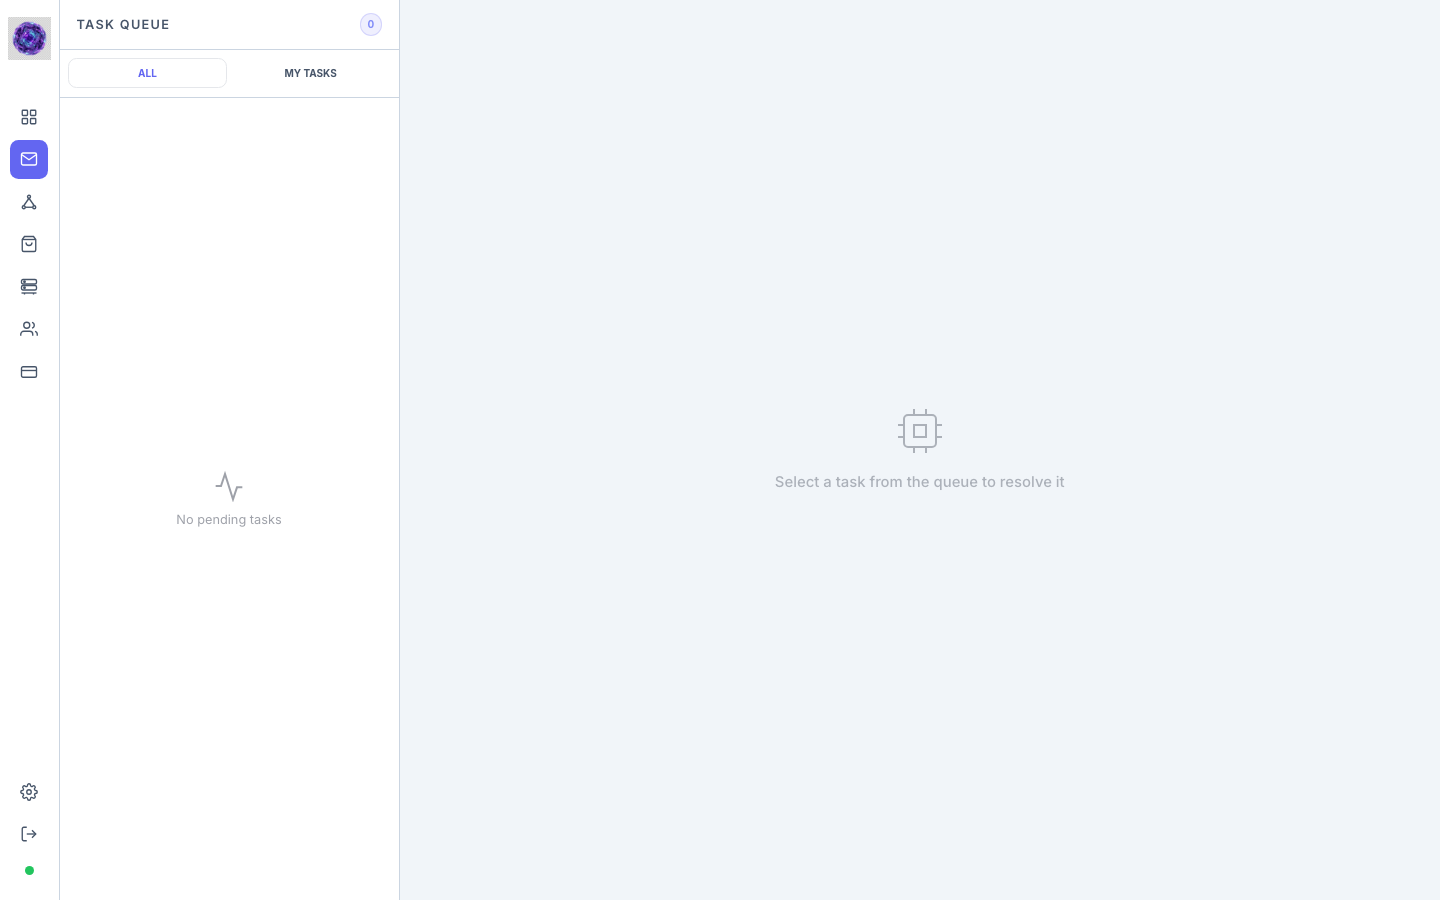
Route: /inbox
The Inbox is the Human-in-the-Loop (HITL) task queue. Whenever a workflow reaches a state that requires human judgment, it pauses and creates a task here. The sidebar icon shows a red badge with the count of pending tasks.
Layout
The page uses a master-detail split:
- Left panel — task list with two tabs:
- ALL — every pending HITL task across all users
- MY TASKS — tasks assigned to the current user
- Right panel — task detail view; displays the task context, blackboard data, and action controls once a task is selected
Resolving a task
Click any task in the left panel to load its details on the right. Depending on the node type, the toolbar at the top of the Monitor view exposes Approve / Reject buttons (for hitl-type states) or shows an awaiting indicator (for wait-type states).
Designer
Route: /designer (new) · /designer/:name/:version (existing)
The Designer is the visual workflow authoring environment. It combines a freeform canvas for building state machines with an AI generation panel that can scaffold entire workflows from a plain-language description.
Toolbar
| Control | Purpose |
|---|---|
| ← Back | Return to Dashboard |
| Layout | Auto-arrange all nodes on the canvas |
| Timeouts | Configure global and per-state timeout values |
| Canvas / Split / YAML | Toggle between visual canvas, side-by-side canvas+YAML, and raw YAML editor |
| Add State | Insert a new node onto the canvas |
| ▶ Run | Save and immediately execute the workflow |
| Save | Persist the current version |
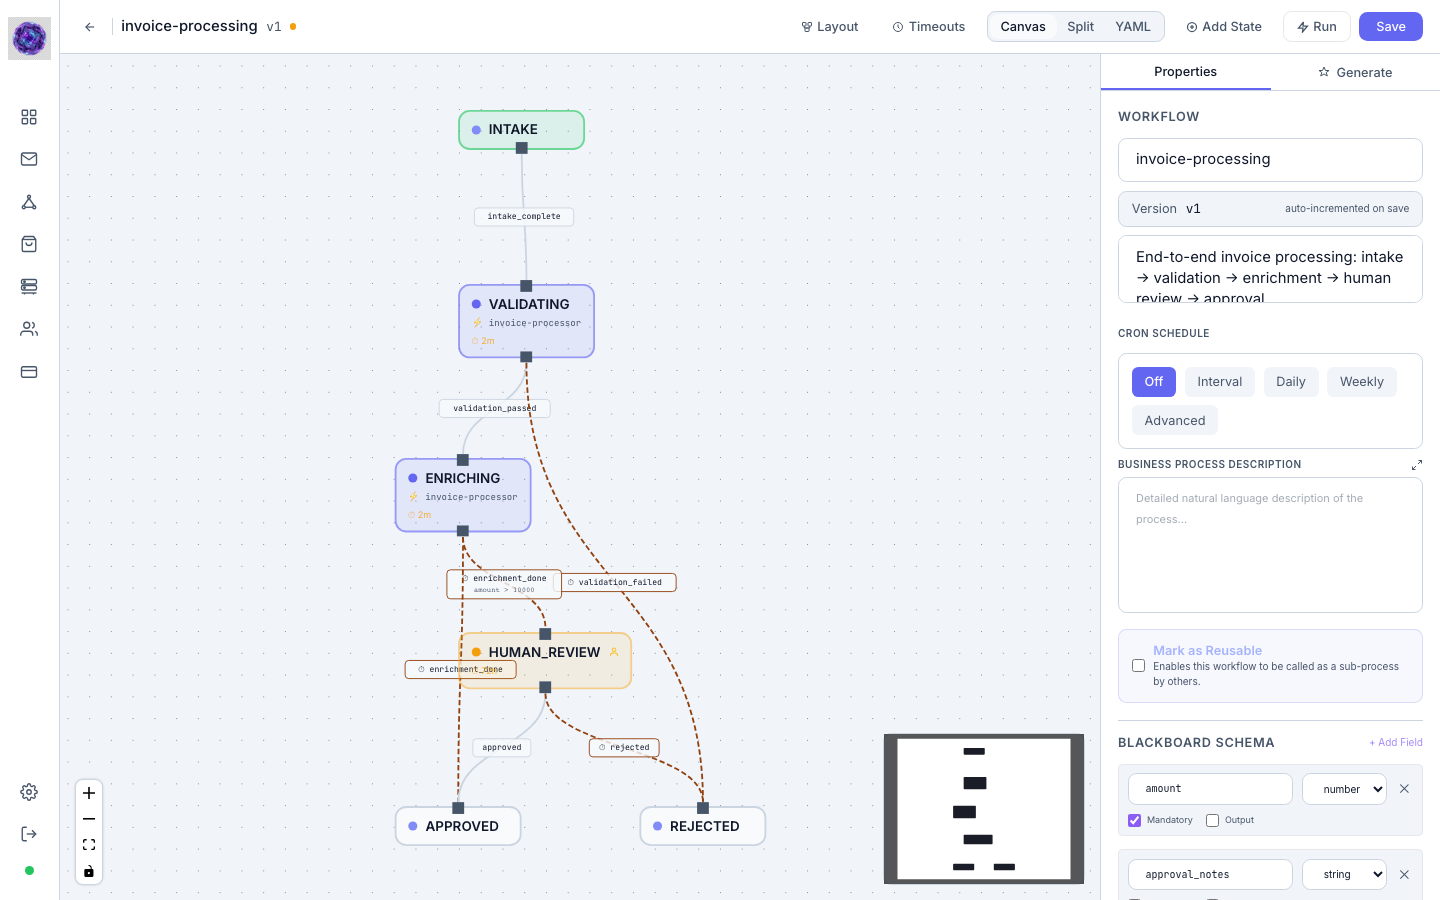
Canvas
The dot-grid canvas is the main editing surface. States appear as draggable cards connected by labelled transition arrows. Controls in the bottom-left corner provide zoom in (+), zoom out (−), fit-to-screen, and canvas lock. A mini-map in the bottom-right shows the overall diagram layout for large workflows.
Properties Panel
The right-hand panel contains two tabs: Properties and Generate.
The Properties tab exposes workflow-level configuration:
- Name and Short Abstract — identifier and human-readable description
- Cron Schedule — Off, Interval, Daily, Weekly, or Advanced cron expression to schedule autonomous execution
- Business Process Description — natural language summary used as context for AI generation
- Mark as Reusable — enables this workflow to be called as a sub-process by other workflows (Pro/Enterprise feature)
- Blackboard Schema — define the shared data contract (fields and types) that all states read from and write to
- Workflow Prompt (Global Personality) — a system prompt applied to every LLM agent state in the workflow
When an individual state node is selected on the canvas, the Properties panel switches to show that node's configuration: type, instructions, MCP tool bindings, transition conditions, and per-state prompts. Note: Sub-Process nodes are restricted to the Pro and Enterprise tiers.
Generate Panel — AI Workflow Generation
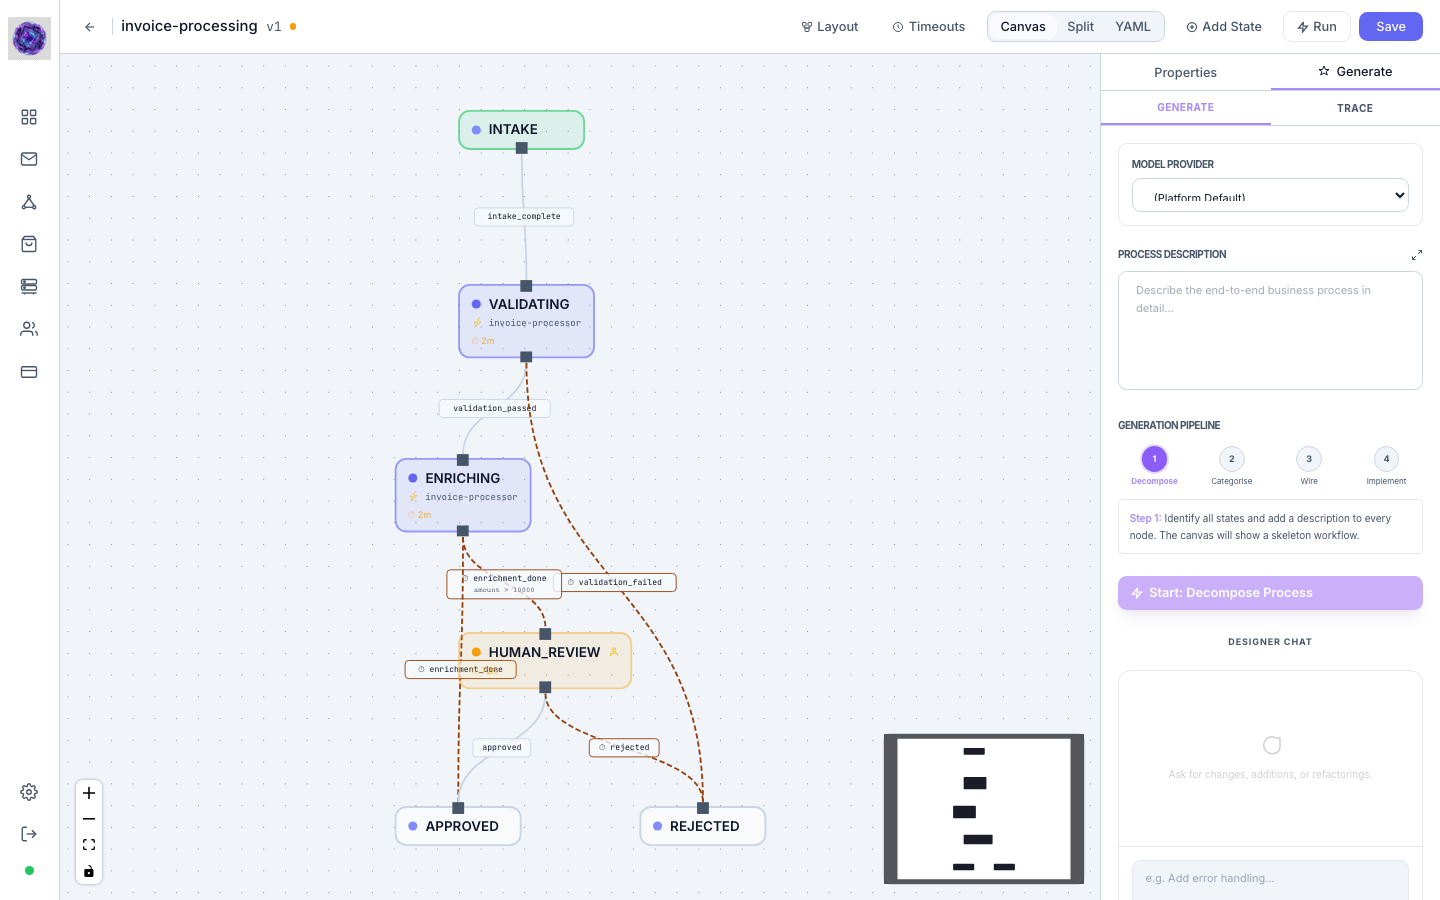
The Generate tab is the AI-powered automation engine. It converts a plain-language business process description into a complete, runnable workflow through a four-step pipeline. The canvas and the Generate panel are live side-by-side: as each step completes, nodes and transitions appear on the canvas in real time.
Sub-tabs
The Generate panel has two sub-tabs at the top:
- Generate — the main authoring interface with the pipeline controls
- Trace — a live log of every LLM interaction from the most recent generation run, useful for inspecting what the model produced at each step or debugging unexpected output
Model Provider
A dropdown at the top of the panel lets you select which LLM provider to use for this generation run. The default option (Platform Default) uses whichever provider is enabled and configured in Settings → LLM Provider Configuration. You can override this per-run to compare results across models.
Process Description
A free-text textarea where you describe the end-to-end business process in natural language. The expand icon (↗) opens a full-screen modal editor for longer descriptions. The richer and more specific your description — covering inputs, decision points, error paths, and expected outputs — the more accurate and complete the generated workflow will be.
Generation Pipeline
The pipeline breaks generation into four sequential steps, each shown as a numbered circle. The active step is highlighted in violet; completed steps turn green with a checkmark.
| Step | Name | What it does |
|---|---|---|
| 1 | Decompose | Identifies all states and writes a description for every node. The canvas shows a skeleton workflow with placeholder nodes. |
| 2 | Categorise | Assigns the correct Chain Nodes node type to every node (code, script, hitl, wait, call, etc.). No executable logic is generated yet. |
| 3 | Wire | Defines all transitions between states, sets guard conditions, and produces the Blackboard Schema — the typed data contract shared across all nodes. |
| 4 | Implement | Generates final executable code for every node in parallel using specialised per-type prompts. The result is a fully runnable workflow. |
The Start: Decompose Process button (Step 1) kicks off the pipeline. After each step completes the button label updates to the next step. Steps can be re-run individually to refine a specific phase without regenerating the entire workflow. The Reset link clears all pipeline progress so you can start fresh from the description.
If the model returns a soft warning (e.g. an ambiguous transition condition), an amber notice appears below the pipeline steps. Hard errors are shown in a red monospace block.
Designer Chat
Below the pipeline controls is the Designer Chat — a conversational interface for making targeted edits to an existing workflow without re-running the full pipeline. Type a change request (e.g. "Add error handling for failed enrichment") and press ⌘ Enter to apply it. The chat sends the current workflow YAML as context and patches only the affected nodes, preserving the rest of the design.
MCP Marketplace
Route: /mcp-market
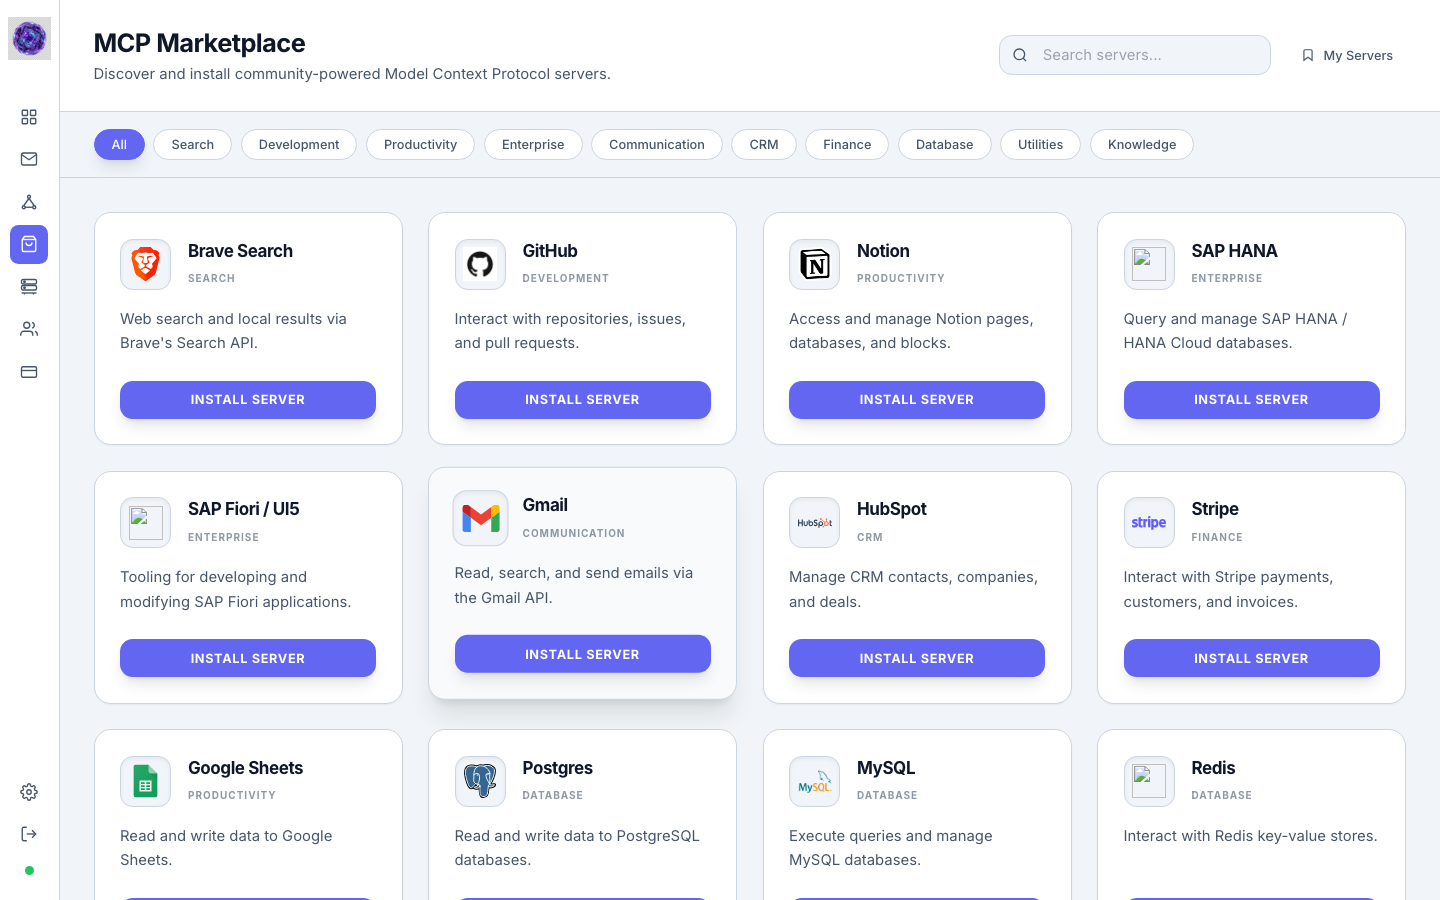
The MCP Marketplace is a curated catalogue of community-published Model Context Protocol servers. Workflows can invoke any installed server's tools as part of their agent state execution.
Components
- Search bar (top-right) — filter servers by name or keyword
- My Servers link — quick jump to the MCP Servers management page
- Category filters — horizontal pill tabs: All, Search, Development, Productivity, Enterprise, Communication, CRM, Finance, Database, Utilities, Knowledge
- Server cards — each card shows the server name, category badge, a short description of its capabilities, and an Install Server button
Clicking Install Server registers the chosen MCP server into your tenant's MCP Servers list, making its tools immediately available to workflow agents.
MCP Servers
Route: /mcp-servers
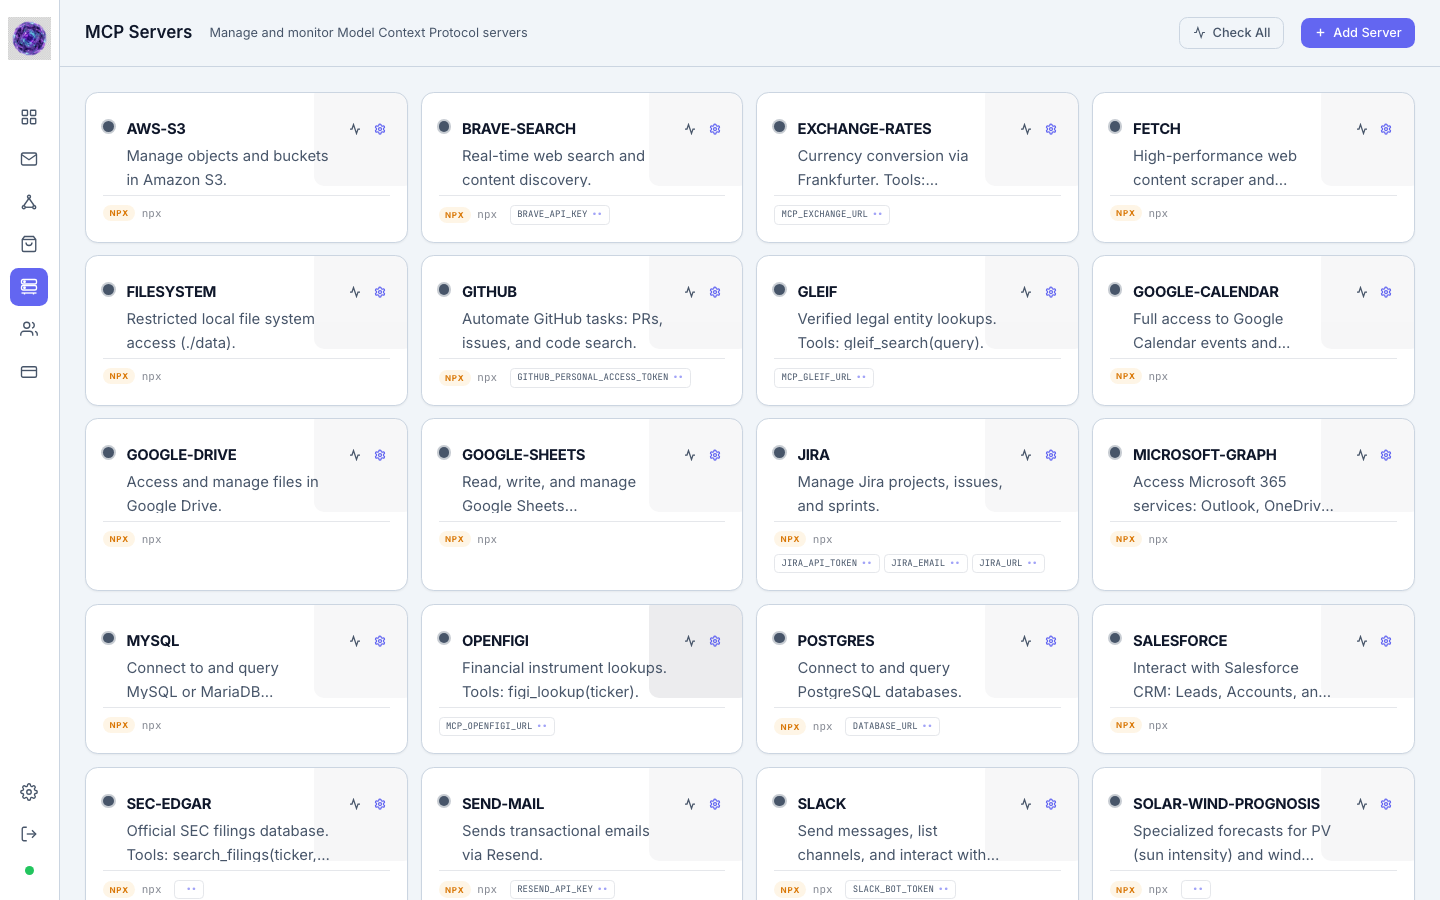
MCP Servers lists all Model Context Protocol servers registered for your tenant, along with their real-time health status. This is where you add, configure, and monitor the tool integrations that your workflow agents use.
Components
- Check All — pings every registered server and updates their health indicators simultaneously
- Add Server (admin only) — opens a modal to register a new MCP server by name, endpoint URL, and description
- Server cards — a responsive grid where each card displays:
- A colour-coded health dot: green (online), red (offline), blue (checking), amber (unknown)
- Response latency in milliseconds (shown in green when the server is healthy)
- Server name, description, and discovered capabilities
- Per-server ping and settings buttons (settings visible to admins only)
Non-admin users can view the server list and health status but cannot add or modify servers.
User Management
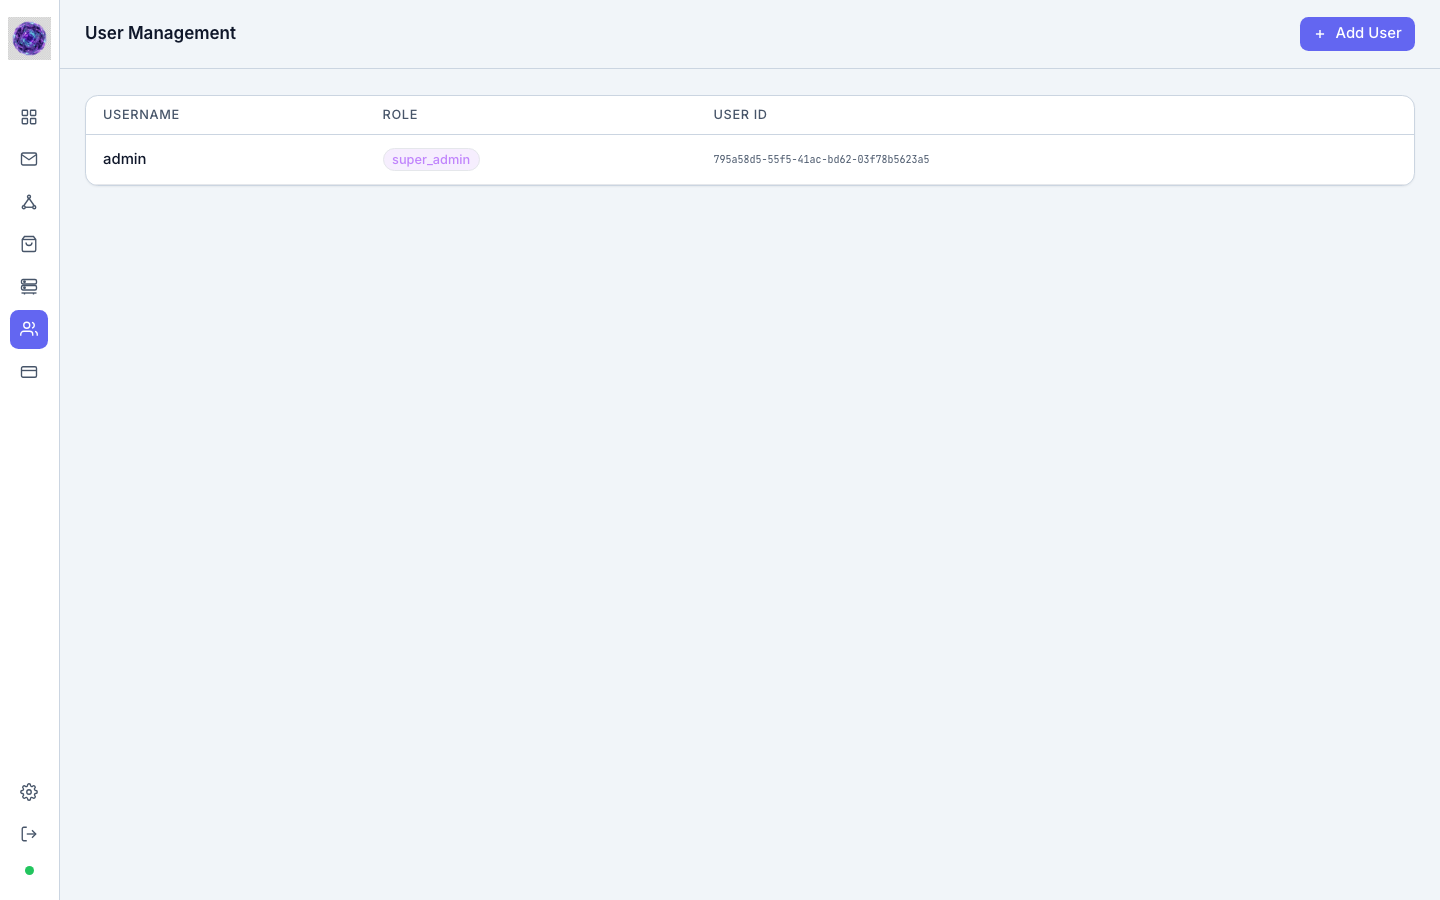
User Management gives administrators a full view of every account in the tenant. In the Free tier, this page operates in read-only mode, allowing you to see existing accounts but not create or manage additional users. Full team management is available in the Pro and Enterprise tiers.
Components
- + Add User button (top-right) — opens a form to create a new user with a username, password, and role
- User table — columns: Username, Role (displayed as a colour-coded badge), User ID
Role badges reflect the user's permission level (e.g. super_admin, admin, user). The User ID column shows the internal UUID for integration and audit purposes.
Usage & Reporting
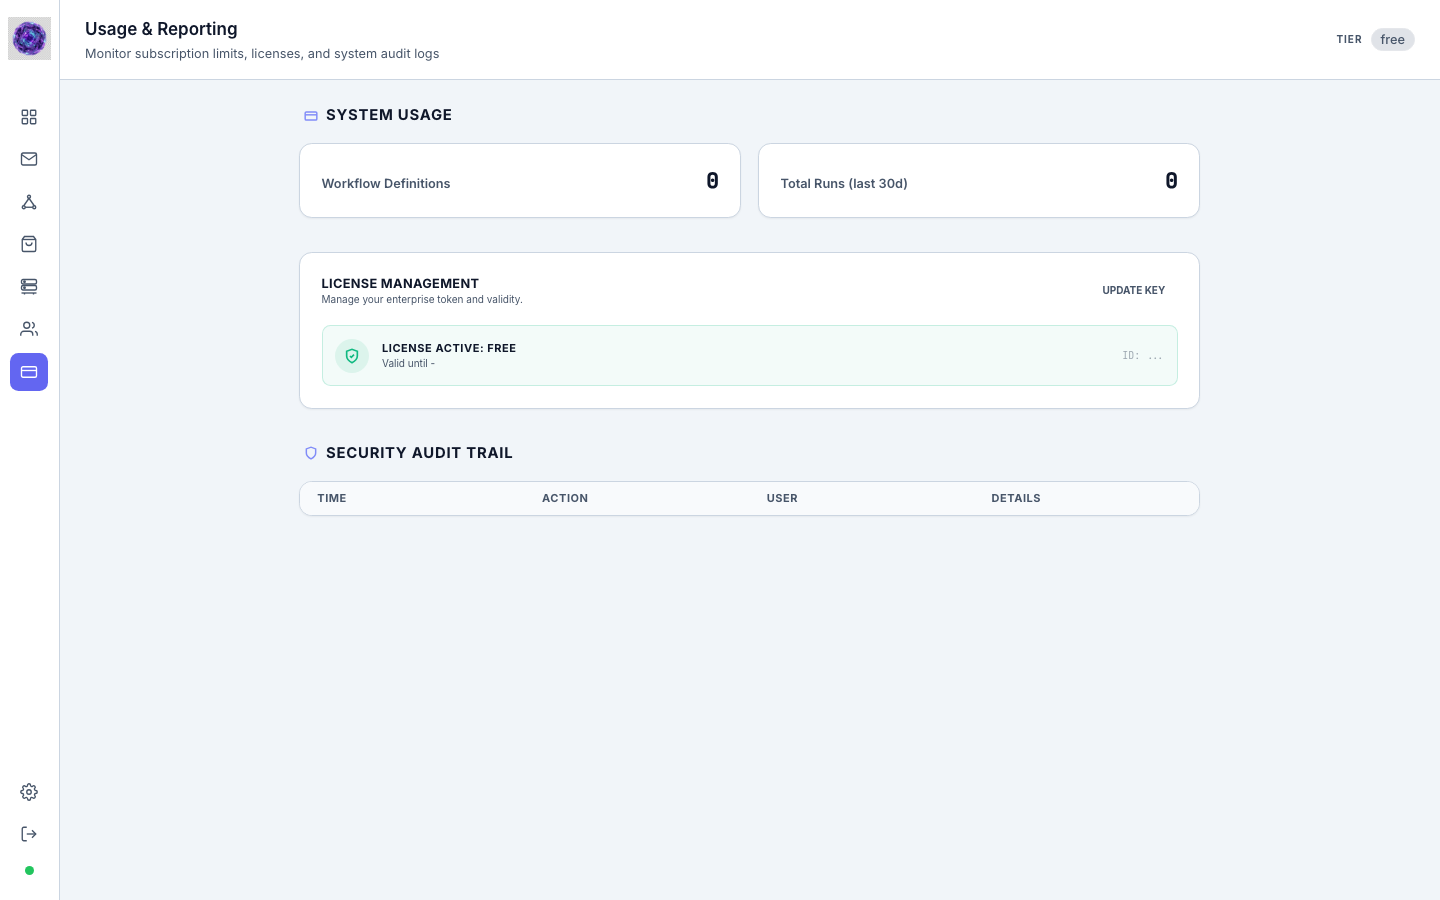
Route: /usage · Admin only
Usage & Reporting is the subscription, license, and audit centre. It tracks resource consumption against plan limits and provides a tamper-evident security trail.
Sections
System Usage
Two counters show current consumption at a glance:
- Workflow Definitions — total number of saved workflow designs
- Total Runs (last 30d) — executions triggered in the past 30 days
License Management
Displays the active license tier (e.g. free, pro, enterprise), the license validity period, and its internal ID. The Update Key action lets administrators paste in a new license token to upgrade or renew the subscription.
Security Audit Trail
An append-only log of security-relevant events. In the Free tier, this section is locked, providing a placeholder view of the audit infrastructure. Full access to historical security logs is available in the Enterprise tier.
Monitor
Route: /monitor/:runId · Accessed from a workflow run
The Monitor provides deep visibility into a single workflow execution. It opens automatically when you click Run from the Dashboard or Designer, and is linked from run entries in the Recent Runs table.
Top Bar
The bar shows the workflow name, a short run ID, and the current execution status badge. Available actions depend on run state:
| Action | Availability |
|---|---|
| Edit | Always — opens the workflow definition in the Designer |
| Re-run | Always — launches a new execution with the same input |
| Approve / Reject | When the current state is a hitl-type node |
| Fire Trigger | When the run is in running state |
| Stop | When the run can be terminated |
| Refresh | Always — reloads run state from the server |
A failure banner appears below the bar when the run status is failed, showing the failure reason in a monospace block with the option to request an AI-assisted fix.
Canvas & Event Log
The lower portion of the Monitor mirrors the Designer canvas with nodes colour-coded by their execution state (pending, running, completed, failed). An event log lists every state transition in chronological order, allowing you to trace exactly how the workflow progressed and inspect the blackboard data at each step.
Time Travel Scrubber
Chain Nodes features a state-of-the-art Time Travel Scrubber situated at the bottom of the execution Monitor canvas. This allows operators to inspect and debug workflows retrospectively:
- Live vs. Travel Mode: Toggle between Live (real-time state updates) and Travel modes. Switching to Travel mode freezes the view, letting you inspect exactly what happened during prior transitions.
- Interactive Scrubber Slider: Drag the slider backwards or forwards to scrub through historical execution steps.
- Incremental Navigation: Click the Step Back (
<) and Step Forward (>) buttons on either side of the slider to walk through transitions step-by-step. - Intelligent Boundaries:
- Both step buttons are automatically grayed out and disabled when in Live mode.
- The Step Back button is grayed out at Step 1 (the start).
- The Step Forward button is grayed out at the final step (the current state).
- Reactive Blackboard Snapshot: As you scrub through time, the Blackboard values and Visual Canvas reactively update to display the historical snapshot at that specific point in time.
Settings
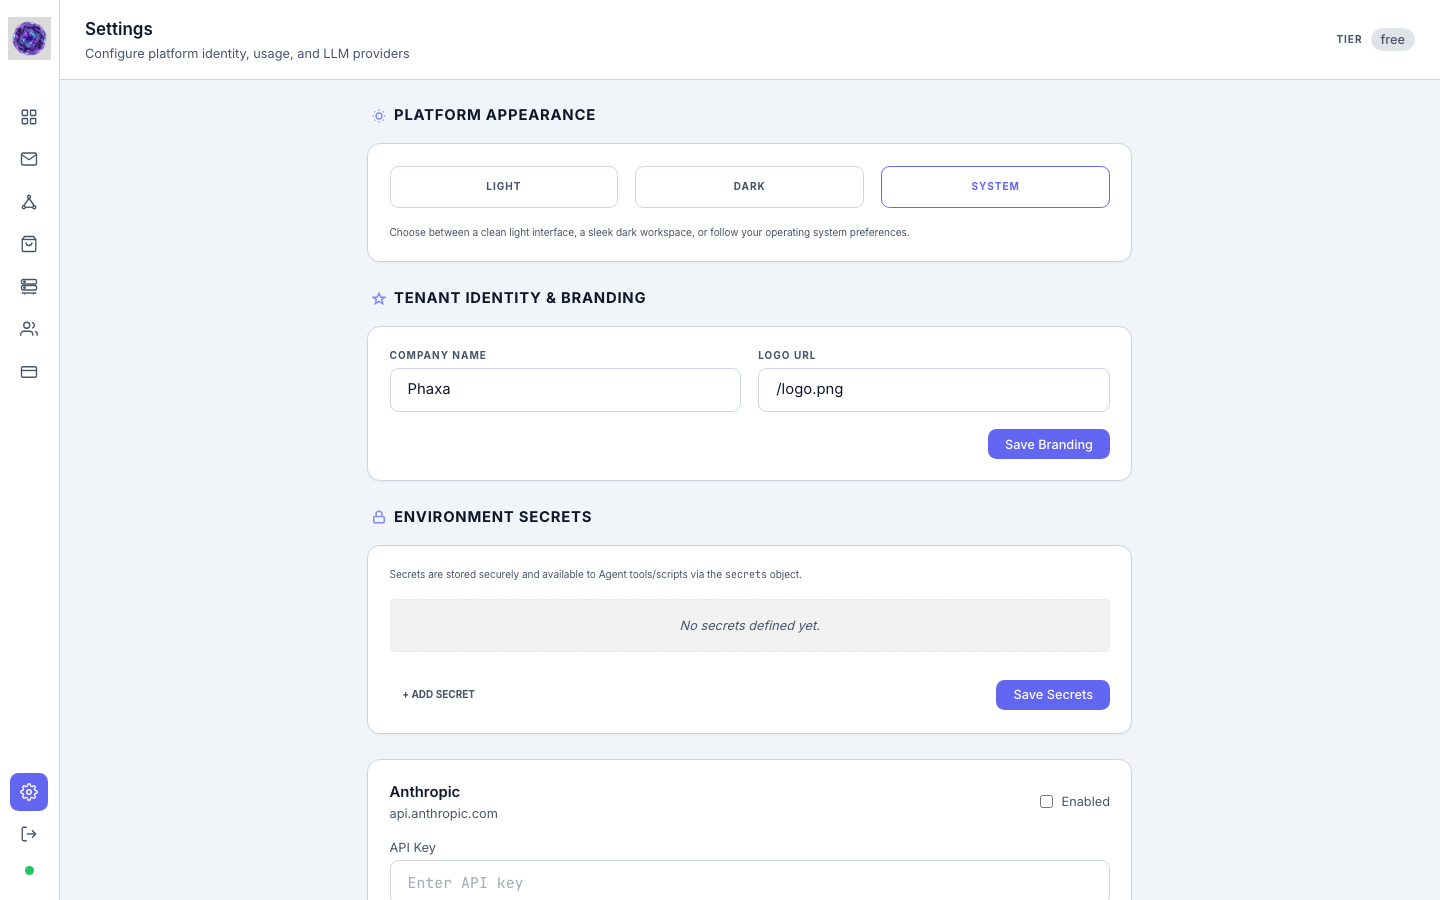
Route: /settings
Settings is the platform configuration hub. It controls appearance, tenant identity, runtime secrets, and LLM provider connections.
Sections
Platform Appearance
Choose the UI theme: Light, Dark, or System (follows the operating system preference).
Tenant Identity & Branding
Set the Company Name and Logo URL for white-label deployments. In the Free tier, this section is read-only, allowing you to preview how custom branding appears across the tenant. Permanent branding is available in the Enterprise tier.
Environment Secrets
A key-value store for secrets that agent tools and scripts can access at runtime via the secrets object. In the Free tier, secrets management is locked. Upgrade to Pro or Enterprise to add and manage secure environment variables.
LLM Provider Configuration
One card per supported provider (e.g. Anthropic, OpenAI). Each card has an Enabled toggle and an API Key field. Enabling a provider makes it selectable in the Designer's Generate panel and in individual agent state configurations. The platform default provider is used by the AI generation pipeline unless overridden at the workflow or state level.